Explore the story behind the mysterious number 6174. Generate all possible chains leading to 6174, show their length and their patterns of convergence.
 Download
 Copy to clipboard
1 2 3 4 5 6 7 8 9 10 11 12 13 14 15 16 17 18 19 20 21 22 23 24 25 26 27 28 29 30 31 32 33 34 35 36 | "Graph the progression towards Kaprekar's constant"
from collections import Counter
def step_function(n):
'Do a single step in the Kaprekar process'
# http://en.wikipedia.org/wiki/6174_(number)
s = format(n, '04d') # 1253 --> '1253'
t = ''.join(sorted(s)) # '1253' --> '1235'
u = t[::-1] # '1235' --> '5321'
return int(u) - int(t) # (5321 - 1235) --> 4086
main_template = '''
digraph kaprekar {
rankdir=LR;
%s
%s
}
'''
node_template = ' "%s" [label="%s: %04d"];\n'
pair_template = ' "%s" -> "%s";\n'
def make_graph(show_counts=True):
'Generate a dot file'
# python analyze_6174.py | dot -Tpng > a6174.png && open a6174.png
step = {i: step_function(i) for i in range(10000)}
outs = Counter(step.values()) # only show destination nodes
nodes = []
if show_counts:
nodes = [node_template % (i, c, i) for i, c in outs.items()]
results = results = [pair_template % (i, step[i]) for i in outs]
return main_template % (''.join(nodes), ''.join(results))
if __name__ == '__main__':
print make_graph(show_counts=True)
|
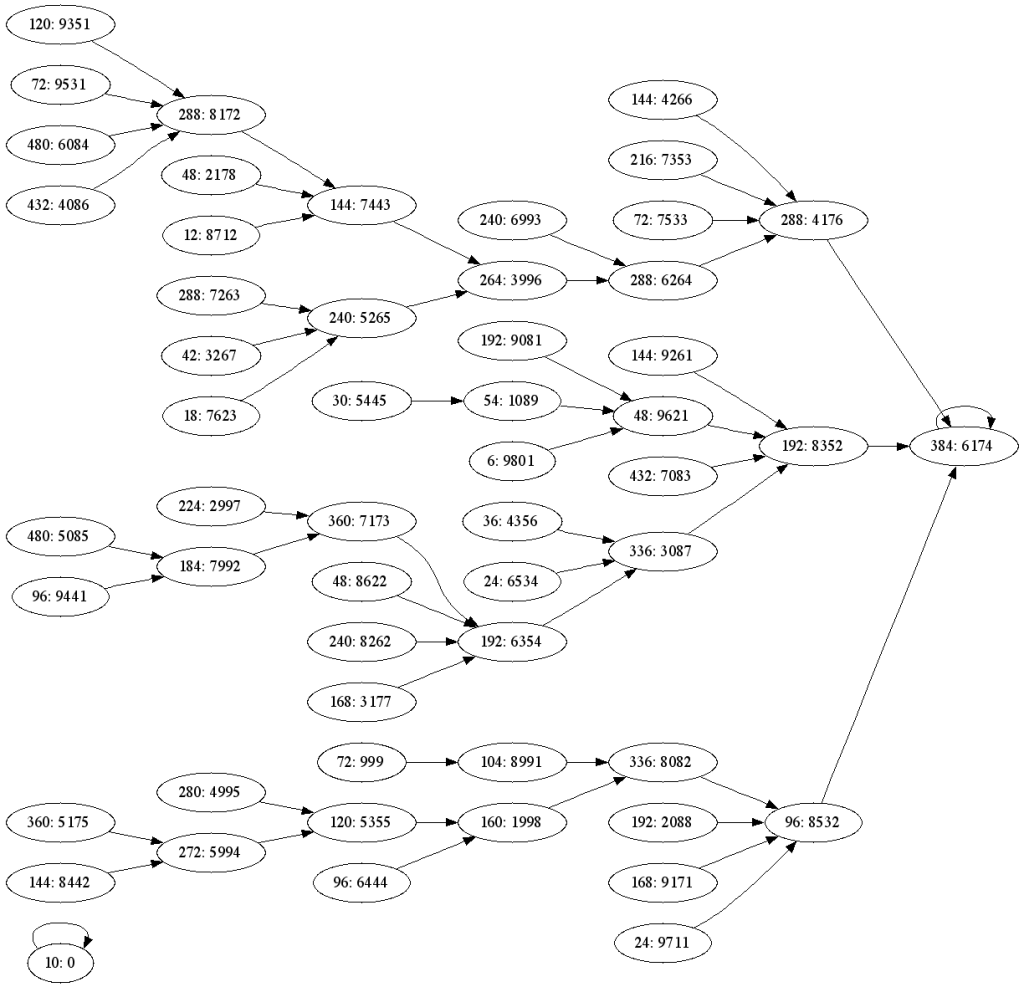
Explore the Krakenpar process detailed in the wikipedia article at http://en.wikipedia.org/wiki/6174_(number)
The step() function computes once step in the process (for example 1253 transforming to 4086).
The main function loops over all possible inputs (numbers below 10,000), building a dictionary of inputs to their transformations.
The dictionary also serves as a cache for the step() function. Function calls are translated to dict.__getitem__ and dict lookups which don't find a result in the cache will call __missing__ which computes the missing value.
The make_graph() function creates a dot file showing the chain of transformations moving to 6147. Since all 10,000 nodes would produce too much visual clutter, the graph only includes nodes at the second step and beyond. If show_counts is set to true, each node shows the count of the number of nodes flowing into it. The output graph is shown at http://i1176.photobucket.com/albums/x332/rhettinger9/KaprekarRoutineFlowGraph.png
